
Returns management in Swedish ecommerce
In our E-barometer Q2 2026, produced with HUI Research, we see that Swedish ecommerce grew 8% in the second quarter. Every category we measure grew. More parcels moved, and the return rate fell at the same time. That might sound like good news for your returns management, but the picture is more complex.
Here we look at how Swedish shoppers return items, what they want instead, and where you can close the gap.
Customer returns are moving toward lockers and stores
In Q2 2026, 5.1 million ecommerce parcels were returned in Sweden, according to Transportföretagen's Paketindex. The service point is still the default: 69% of shoppers who returned an item used one for their latest return. But the mix is changing.
|
Return route |
Latest return |
Latest return |
Preferred route |
Preferred route |
|---|---|---|---|---|
|
Service point |
71% |
69% |
40% |
40% |
|
Store |
10% |
16% |
21% |
19% |
|
Parcel locker |
13% |
11% |
6% |
16% |
The parcel locker stands out. The share of shoppers who prefer to return this way has nearly tripled since 2021, from 6% to 16%. Among frequent online shoppers, who buy several times a month, it is 20%, compared with 10% among those who shop less often.
Yet only 11% used a locker for their latest return, and our survey of retailers shows that just one in three offers locker returns. Shopper demand is ahead of what the market offers.
The store is the other route to watch. 53% of shoppers think returning an online purchase in a physical store should be easier, up from 50% a year earlier. Many already move between channels: 71% have used a store's app or website while in a physical shop.
Age and location shape habits too. Among 18–29-year-olds, one in five used a parcel locker for their latest return, compared with one in ten among 65–79-year-olds. And 46% of shoppers in Stockholm, Gothenburg and Malmö return an item as soon as possible after receiving it, compared with 35% in the smallest municipalities, where return points are further away.
The pattern is the same as with delivery. Shoppers want to choose the option that fits their day, and returns need to be as flexible as delivery.
Why a low return rate isn't always good news for ecommerce returns
The return rate fell in the first half of 2026, even as parcel volumes grew. Part of the reason is structural. One in three ecommerce parcels now comes from abroad, up from one in six in Q2 2022, and at least 12% are second-hand parcels. Pharmacy, our fastest-growing category at 13%, rarely generates returns. Shoppers are also more price-conscious and make fewer impulse purchases.
But we also see friction. Among shoppers who regretted a purchase and chose not to return it, the most common reasons are:
- Too complicated, or I couldn't be bothered: 34% overall, 40% for purchases from abroad
- The item was worth too little: 33% overall, 37% for purchases from abroad
- I didn't want to pay the return cost: 8% overall, 11% for purchases from abroad
The gap with foreign retailers is closing. The share of shoppers who have returned an unwanted purchase from abroad rose from 37% in 2024 to 53% in 2026, compared with 65% for online purchases overall.
For ecommerce returns, this means a falling return rate can hide returns that never happened because the process was too hard. Some items were resold or left in a drawer. Look at the return rate together with the return journey, including which routes shoppers use and why items come back, and you get a truer picture.
Prevention: fewer returns start on the product page
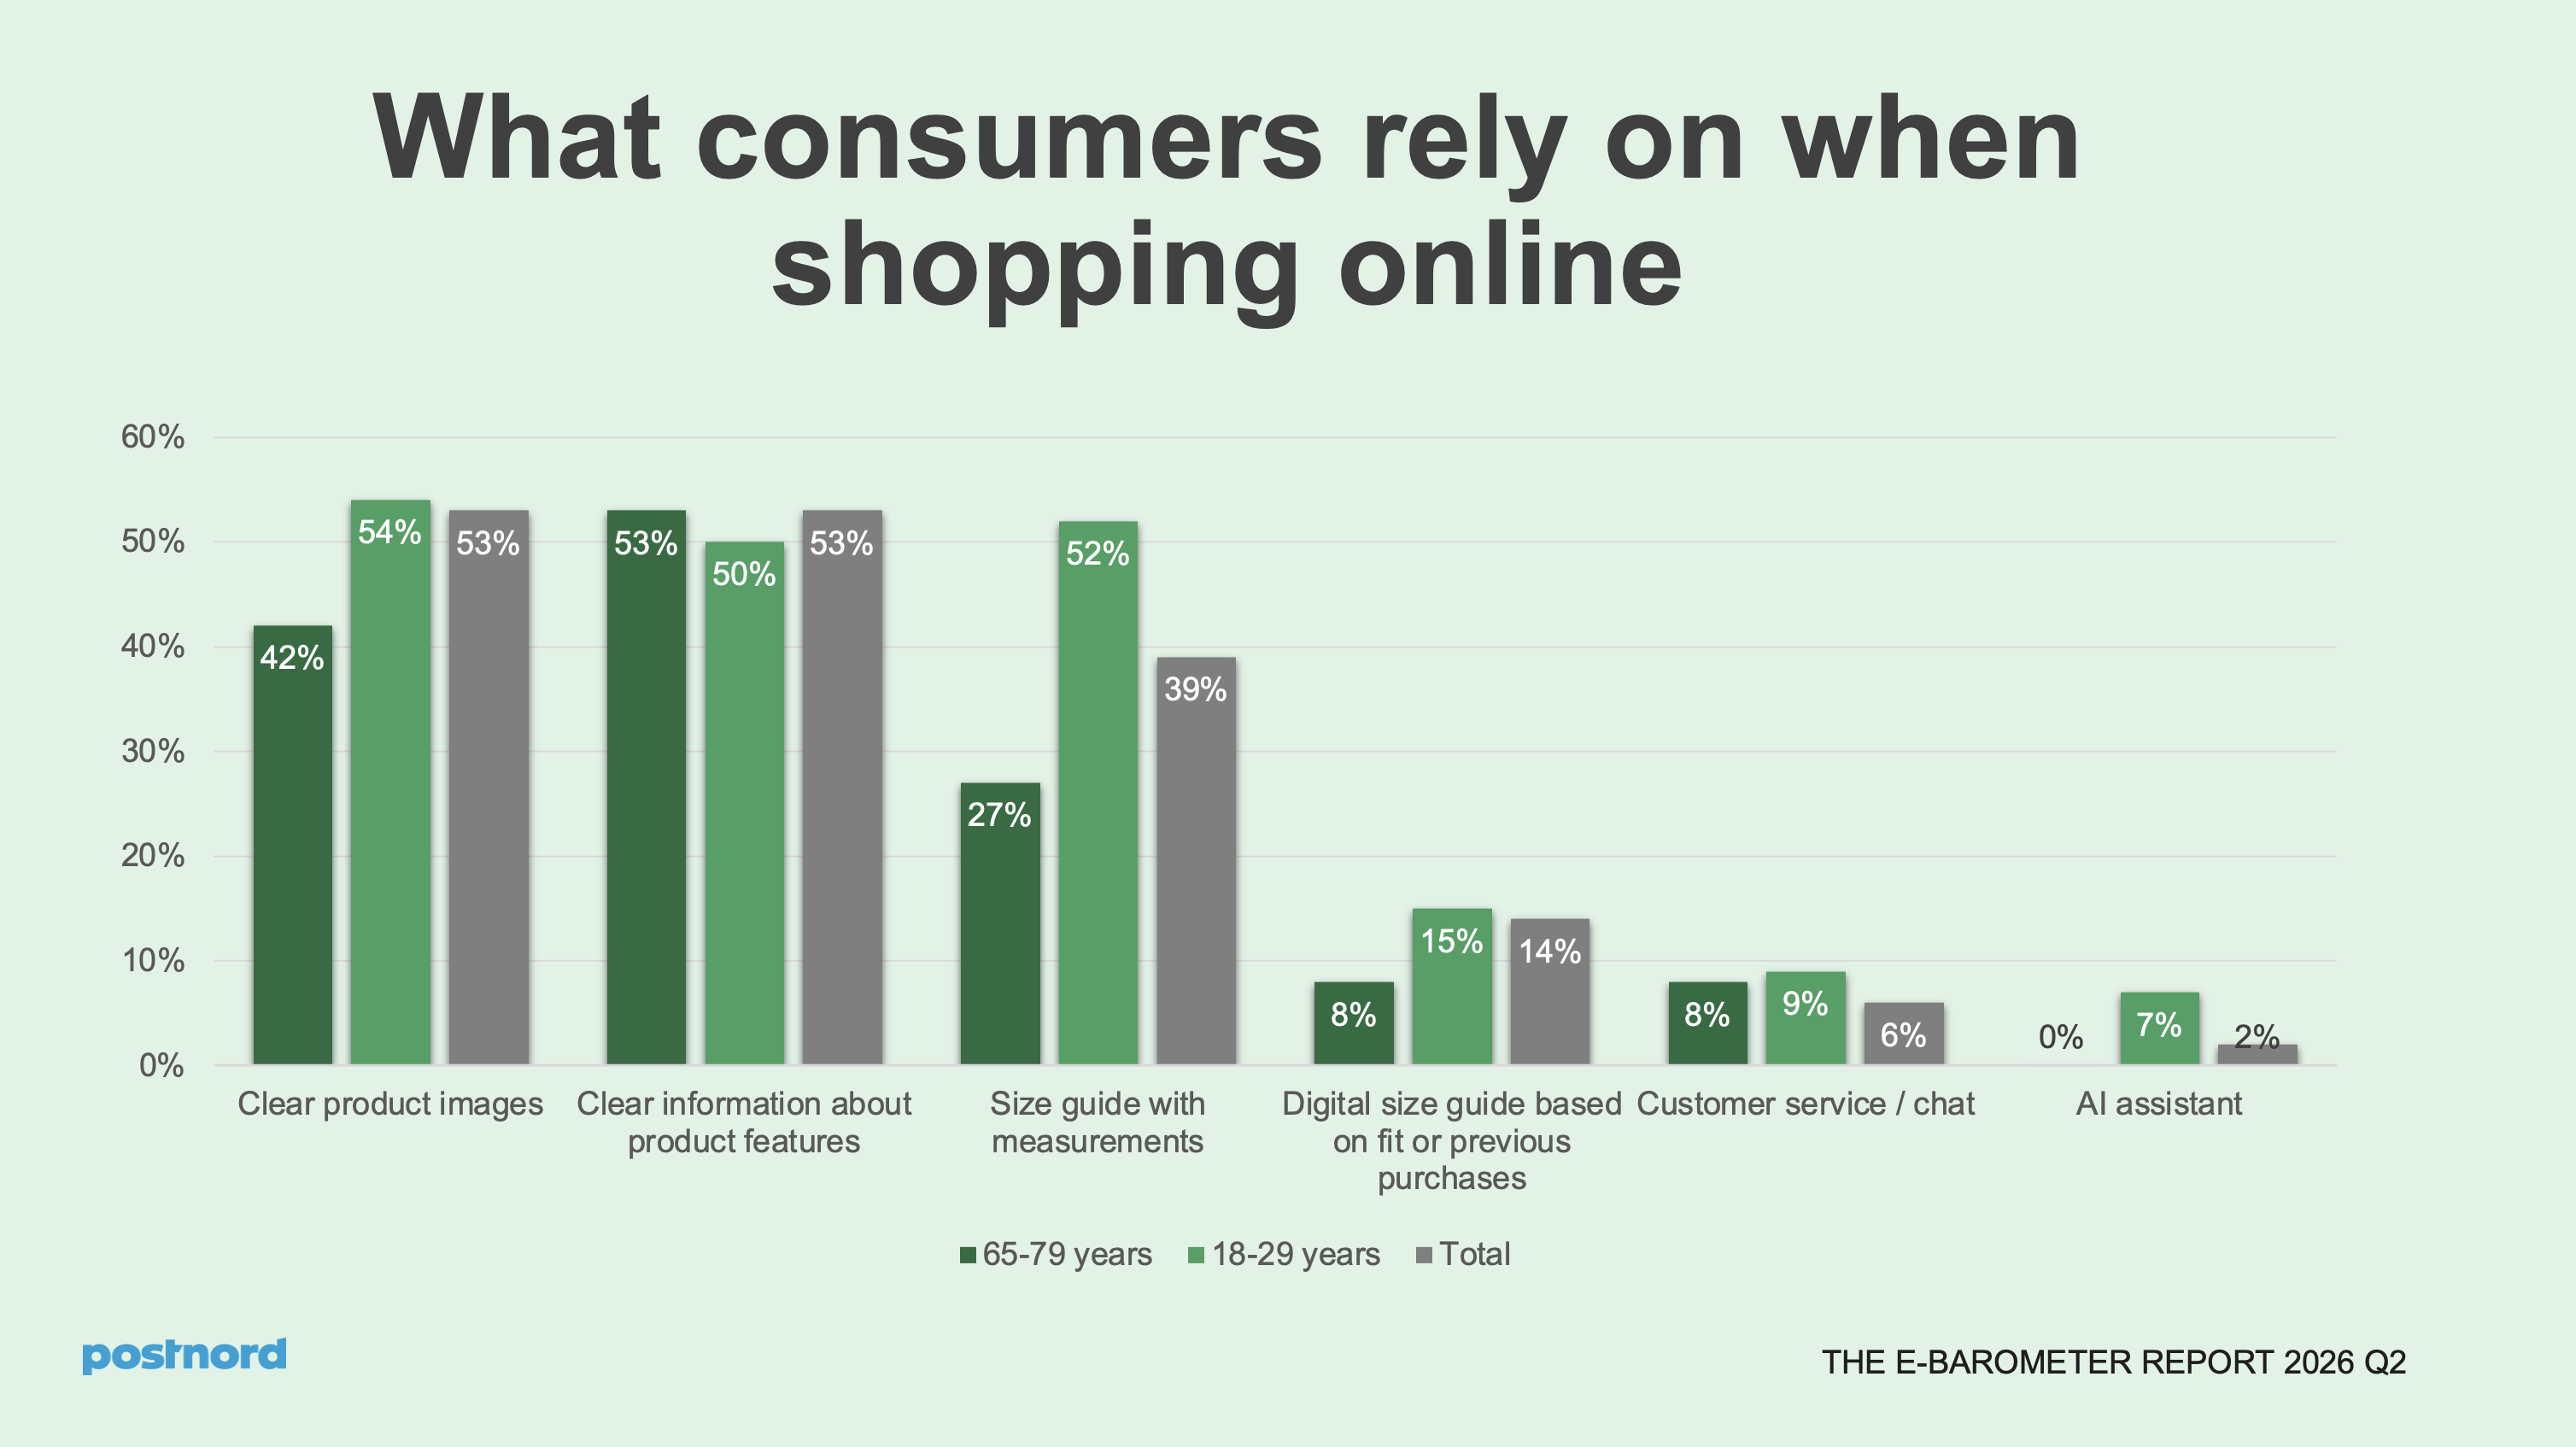
Returns are shaped throughout the purchase journey, and your product page is the first chance to prevent an unnecessary one. Shoppers tell us the most helpful aids are:
- Clear product images (53%)
- Clear information on product features (53%)
- Size guides with measurements (39%)
Newer tools are far behind: digital size guides based on fit or past purchases (14%), chat or customer service (6%) and AI assistants (2%). The basics remain the foundation, especially in fashion, where poor fit is one of the most common reasons for returning an item.
Retailers are testing new approaches, though. In the report we highlight Adoore, where shoppers enter their measurements to get a size recommendation, Altaria AI, which flags high-risk purchases such as several sizes of the same garment, and Ikea Kreativ, where shoppers can use VR to see how furniture fits their home. The goal is not to make returns disappear, but to help shoppers get it right from the start.
Building returns management solutions around the shopper's day
Our data points to four priorities when you evaluate returns management solutions:
- Offer more than one return route. Service points still dominate, but locker preference has nearly tripled and store returns are growing. A return option that is as easy to choose as your delivery options meets shoppers where they are.
- Connect lockers, service points and stores into one return journey. Our conclusion in the report is that retailers should make returns as simple to choose as delivery.
- Make refunds follow the payment. In our interview, Tobias Lindh of Adyen explains that refunds should go back through the original payment method, including partial refunds when only some items are returned, and as quickly as possible. Slow or awkward returns can create badwill.
- Measure friction, not only volume. Track how many returns are started, completed or abandoned, which routes are used, and why items come back. Then feed those reasons back into your product pages.
Charging for returns is part of the picture. According to Reclaimit, cited in the report, one in three consumers has changed their buying behavior because of return fees. Fees can reduce returns, but they work best when the process around them is clear and fair.
Making returns as easy as delivery
Swedish ecommerce is growing, and shoppers' expectations are growing with it. Delivery has become flexible, with lockers, service points and home delivery to choose from. Shoppers now want the same flexibility when they return. By matching your return options to your delivery options, removing obstacles and preventing avoidable returns, you can meet those expectations.
Read the full E-barometer Q2 2026 , or contact us to talk about how to build returns into your ecommerce offer.